This report analyses the basic salaries, not including bonus and sign-on, across the front and back office, excluding technology (a separate report on tech salaries can be found here) for the quant trading industry in 2020 and 2021 from a universe of 90+ quant hedge funds and proprietary trading firms.
Jump to:
This analysis has been compiled using salary data captured from H1B visa filings. We believe H1B salaries do not deviate significantly from the local rate and therefore are a good reference point.
We would like to caveat that following the Jan 2020 introduction of Labor Law Section 194 in New York, and similar rules in other states, it became illegal to ask for current or historical salary data so H1b filings provide the only factual indicator. Again, we would like to stress this report should only be used to compare basic salaries as data on bonuses, sign-on etc is not available. We also need to caveat we were unable to break the data down by level or experience (except from a few applications that we were able to identify seniority from the job title) which does skew the figures (although base salaries do tend to cap out around the $250-300k mark, but again with a few exceptions gathered in the data).
We broke down the sample universe into Front Office and Back Office. The breakdown of functional area is as follows:
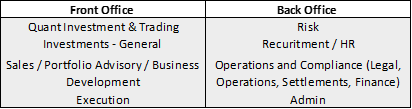
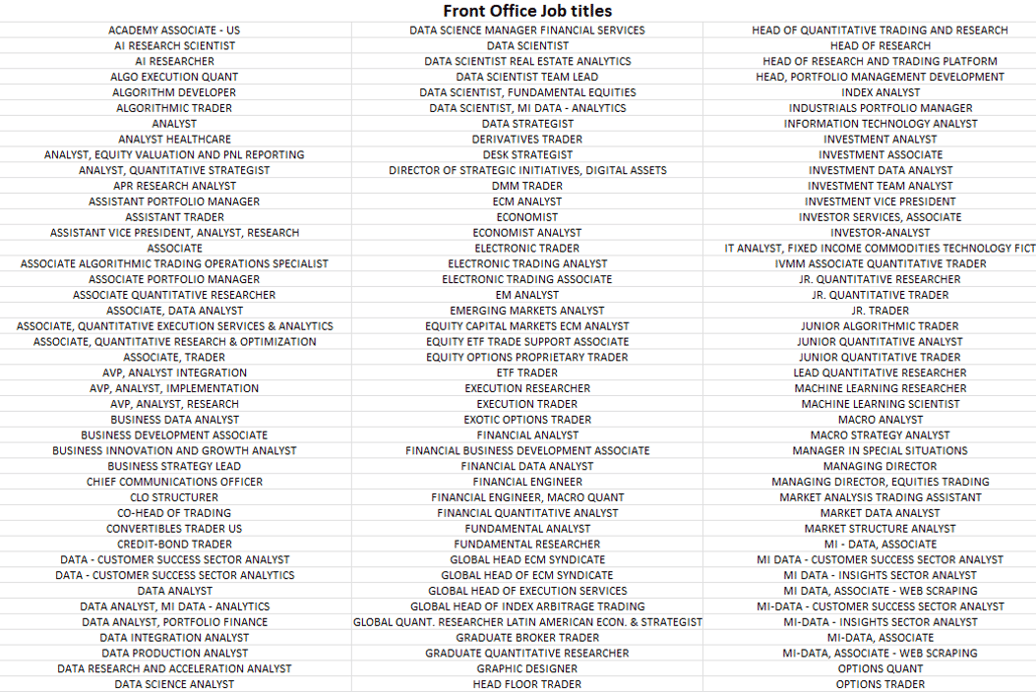
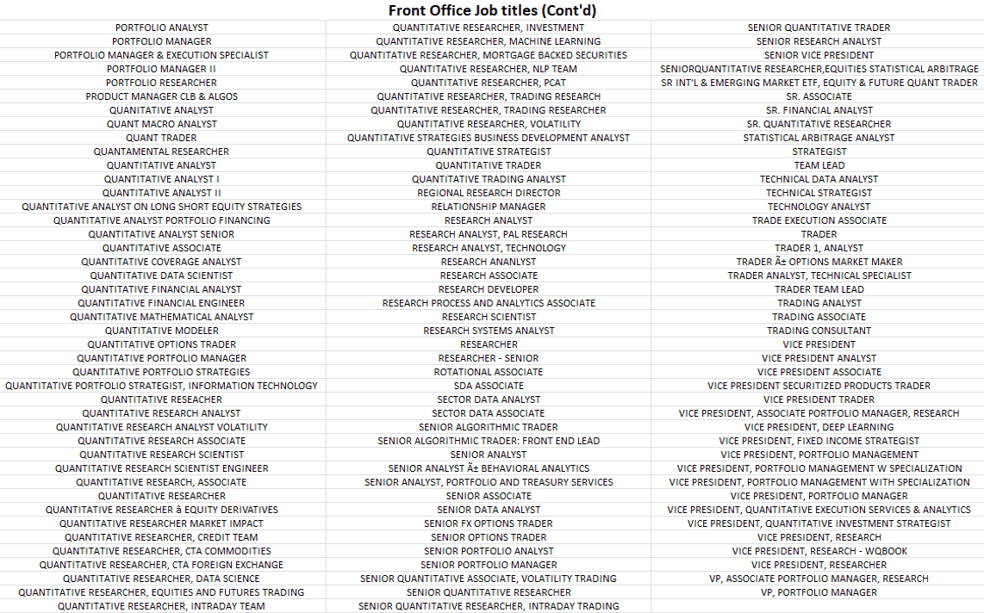
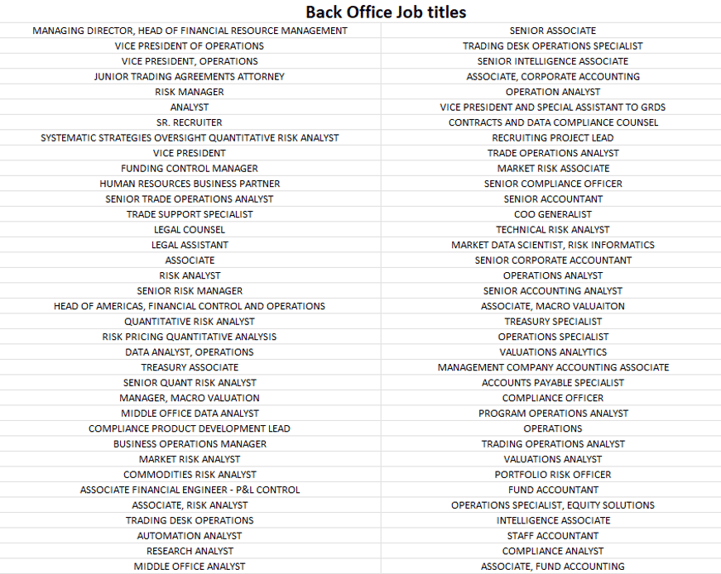
We have included a breakdown of the job titles at the bottom of the report. For a more detailed analysis by job title, company or location please click here
Overview
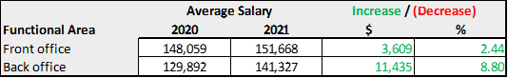
The number of data points and average salaries for each functional area was as follows:
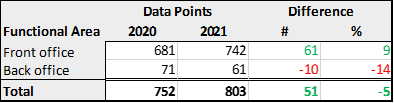
There was a 9% increase in H1B applications across the front office in 2021. Although Covid would have impacted the numbers for 2020, the majority of of H1B applicants are in the first half of year and would have been in process before the pandemic really kicked off. There was a bigger shift in the back office with a 14% decline in number of H1B applications.
Front Office
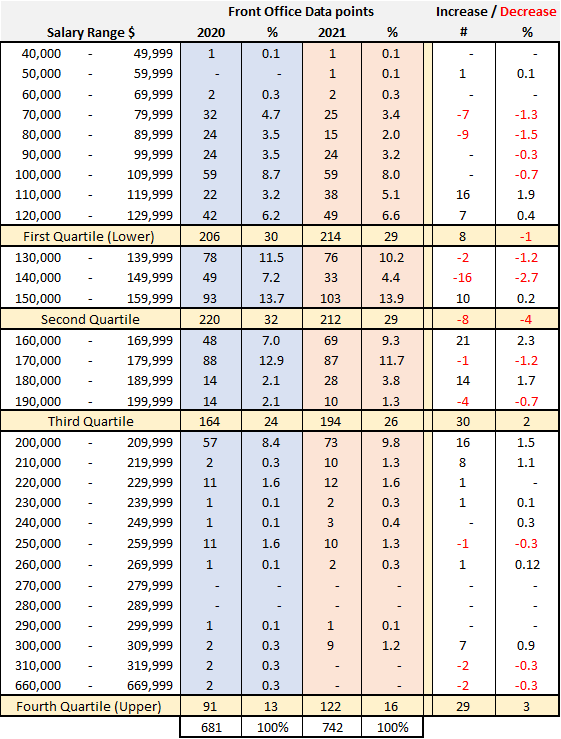
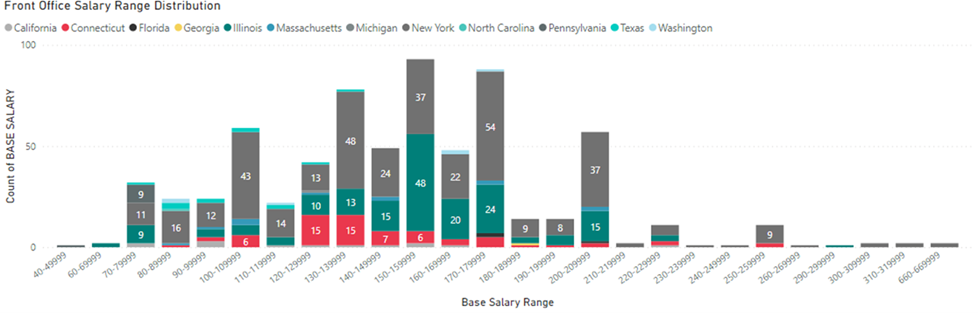
The overall salary range within front office was substantially wide starting at a minimum of $40,000 up to a maximum $660,000. The proportion of data points within the first and second quartile saw a slight decrease in terms of %, occurring in the $70,000 – $109,999 range and in the $130,000 – $149,999 range. On the other hand, the proportion of data points within the third and fourth quartile saw an increase, particularly in the $160,000 – $169,999 range. This perhaps reflects the higher demand for workers/higher salaries as also observed in the increase of average salaries from 2020 to 2021. For a more detailed analysis by job title, company or location please click here.
2020
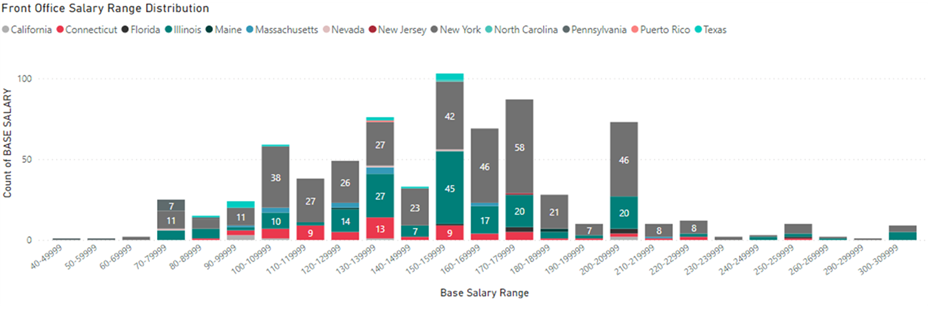
2021

Back Office
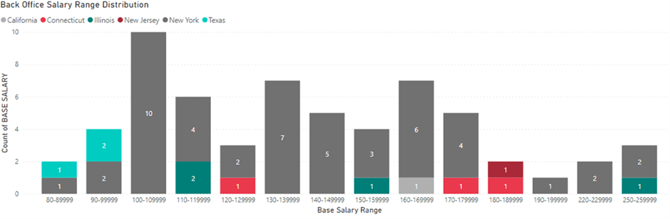
The dataset for back office was limited when compared to front office. The starting salary range for a back office employee was about $60,000 and went up to $335,000. Most data points were concentrated in the first quartile and decreased, as the salaries increased. The first quartile observed a 19% decrease in hiring.
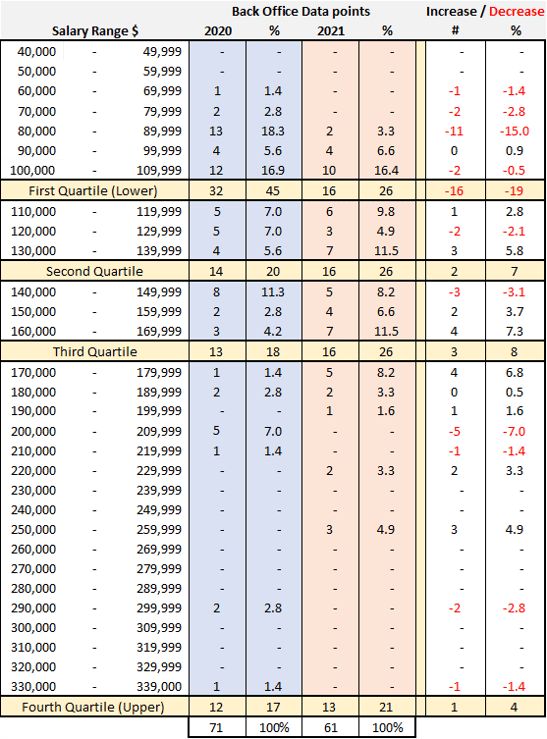
2020
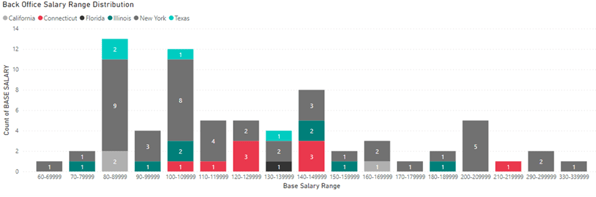
2021
Locations
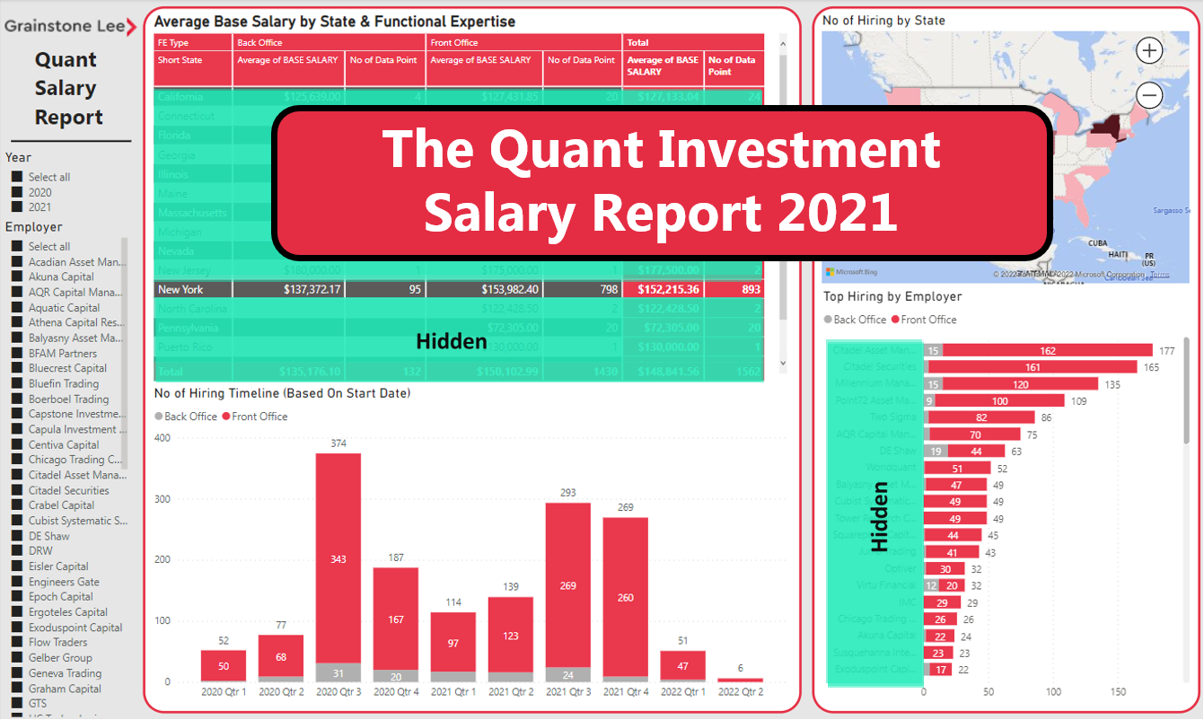
Despite a shift in attitude toward remote work, major hubs continue to dominate H1B applications. This suggests that employers are less willing to sponsor a remote worker, which makes sense if the employee is a recent graduate or has relocated to the United States. The number of US States employees were based increased from 12 to 13 in 2021 which is a relatively small increase. With a massive 57% and 25% share, respectively, the two major hubs of New York and Illinois swallowed most of the talent.
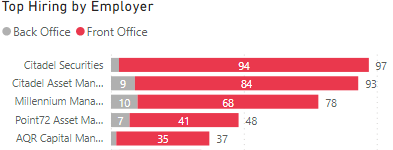
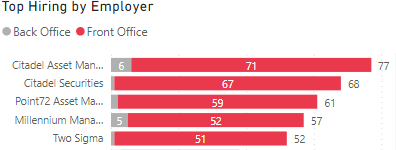
Top Hiring Firms
Citadel Securities and Citadel Asset Management were the largest sponsors, dominating the top 2 positions for both years. Both Citadel Asset Management and Citadel Securities have sponsored a total of 170 and 165 employees respectively, with the majority in the front office. The top five spots are filled by the usual suspects, with the only notable exception being the absence of Two Sigma in the Top 5 2020. In 2020, they sponsored 34 applicants, which is less than the 52 in 2021.
2020
2021
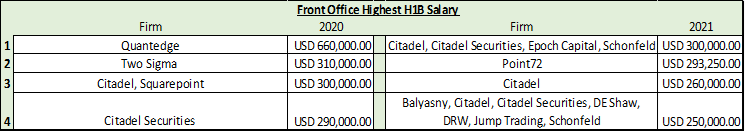
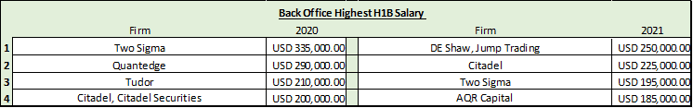
Who pays the most?
Instead of using the average to determine the highest paying employer as this would be skewed by the lack of data points for some firms in the sample universe, we decided to look at pure numbers to rank. We have compiled the top 4 for each functional area based on the highest salary included in a H1B application (as mentioned before this does not include bonuses or sign on payments). The significant outlier was Quantedge, paying double the base salary at $660,000, although these were for executive roles based on the job title in the H1B application.
Additional Information
If you are a corporate entity and would like access to an online dashboard with the ability to drill down into the complete data set (firm, location and/or job title) please click here.

If you would like to confidentially benchmark your salary or discuss the report with one of our consultants please click here.
Breakdown of Job Titles
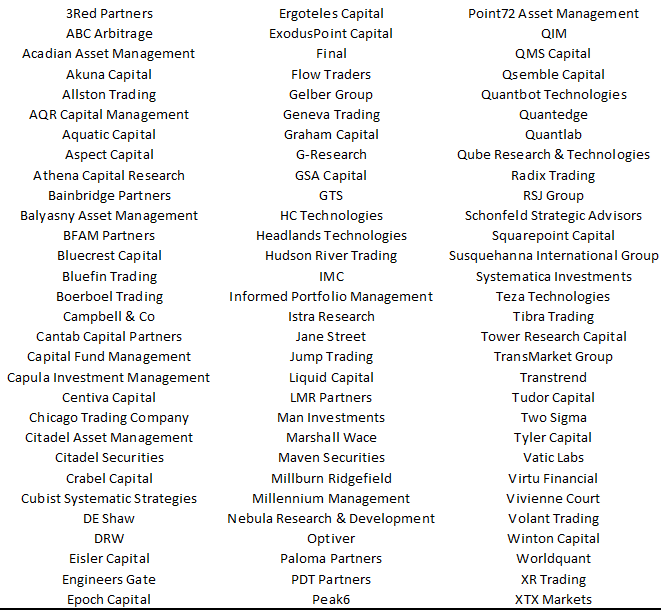
Sample Universe List